If you search back through .NET discussion groups you’ll see many conversations like this. Newcomer to .NET says: “I’ve just been looking at Task Manager. Why does my simple VB.NET Windows application use 12MB RAM?” The answer comes back, “Don’t worry. The app doesn’t really use that much RAM; Windows will give it back if other apps need it. Minimize your application and you’ll see how little it really needs.” Newcomer minimizes the app, and sees the Mem Usage reported go down to say 750K. You don’t even need to minimize it: if you execute the API call SetProcessWorkingSetSize with -1,-1 arguments, then Windows will trim the working set immediately.
However, the point that needs emphasizing is that the minimized figure is just as misleading as Task Manager’s figure. Here’s my high-level understanding of how it works. What Task Manager reports is called the Working Set. This is the amount of physical RAM allocated to the process. To complicate matters, some of the memory in the Working Set may be shared with other processes, including parts of the .NET runtime. Therefore, there is double counting in Task Manager’s mem usage column. Windows may also allocate additional memory to the process in case it may be needed later. For these reasons, the Working Set may overstate the real memory requirements of the application.
It can work the other way too. When you trim the Working Set, Windows not only trims unneeded memory from the allocation, but also pages memory to disk where possible. The Working Set does not include memory paged to disk. In this case, the Task Manager figure understates the real memory requirements.
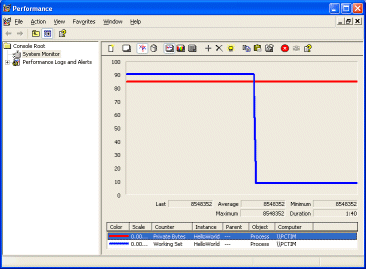
If you’ve not done so before, try this experiment. Fire up Performance Monitor (Start – Run – Perfmon). Then start up your .NET application. Note the Mem Usage figure in Task Manager. Then go to Perfmon, right-click the list of counters at the bottom of the right-hand pane and choose Add counters. In the Add counters dialog, choose Process under Performance object. In the Instances list, select your .NET application. In the Counters list, select Private Bytes and choose Add. Then select Working Set and choose Add. Close the dialog.
In Perfmon, you can get the current value of a counter by selecting it in the list. You’re likely to find that the Working Set value is higher than the Private Bytes value, and matches the value in Task Manager. Bear in mind that Task Manager reports Kilobytes, while Perfmon shows a decimal value. Now minimize the .NET application. The figure for Working Set drops like a stone, but Private Bytes remains the same, typically much higher. Now Task Manager has changed from pessimist to optimist. See the illustration above.
So what are these Private Bytes? This is memory allocated to the process that cannot be shared by other processes. It is probably the most useful single figure when you want to know “How much memory does my app use?” It still needs qualification. As we’ve seen, the Private Bytes may not all be in physical memory. If they are swapped to disk, and the user isn’t actively using the application, then they aren’t having much impact on other applications.
Here are a few further observations.
First, Windows generally does a good job of memory management. High figures in Task Manager needn’t concern the user if the system is running well.
Second, .NET applications really do have a high memory footprint relative to most native code applications (Java has the same problem). This isn’t too important on systems with plenty of RAM, but becomes a major issue in constrained environments like Terminal Server or Citrix clients.
Third, don’t use the mem usage column in Task Manager for diagnostics or profiling. Use the Perfmon counters, especially Private Bytes and the specific .NET counters that will reveal problems like memory leaks.
Fourth, what really counts is performance and user satisfaction. Memory usage is one of many factors that make up performance, and it’s important to keep it in perspective. Keep an eye on the available physical memory on Task Manager's Performance tab; if this reports hundreds of MB free, your .NET app is not really stressing the system.
Finally, there isn't much developers can do about the memory footprint of the .NET runtime. That's down to Microsoft, and it will be interesting to see how .NET 2.0 compares when it comes out of beta. However, there is a lot that developers can do to make applications that use memory efficiently and avoid leaks. This mostly involves looking at the .NET counters rather than the system counters. Use of a profiler is near-essential; I like the SciTech one listed below.
Links
MSDN article on evaluating memory usage
Blog article on CLR performance troubleshooting - by the lead developer in Microsoft's CLR performance team,
Copyright Tim Anderson 10th March 2005. All rights reserved.