Someone was trying to use the bridge application I have in progress, using an iPad 2.0. There were a couple of interesting things about this. One was that I had to rethink the warning thrown up, base on Modernizr, which detects incompatible web browsers. The problem (obvious when you think about it) is that if you use some potentially incompatible features in the same page where you are testing for them, then with an old web browser the JavaScript fails with a syntax error and the warning does not appear. The fix: I now show the warning by default, and the compatibility check hides it.
Still, I was interested in the Safari error and wanted to debug it, in case it was something I could fix. How do you debug Safari on an iPad? The way it is meant to work is this:
– On a Mac, enable the Safari Develop menu (in Safari preferences, Advanced, Show Develop menu).
– On iOS, enable Safari Web Inspector (Settings – Safari – Advanced – Web Inspector).
– Connect the iPad to the Mac via USB. You can now use Web Inspector on the Mac to debug the Safari iOS pages and scripts.
This did not work for me on my Catalina Mac. The iOS Safari did not show up in the Web Inspector on Safari Mac. I could get it to show briefly, by switching Web Inspector on the iPad off and on again, but after than, no go. I tried a few things, but none of the proposed solutions I could find for this issue fixed it for me.
I have an older 2011 Mac Mini in a drawer, so I thought that might work, being a similar age to the iPad. I fired it up, marvelled at how old-fashioned the UI looked (I had reset it to OS X Lion), and connected the iPad. No go. Same problem as with Catalina.
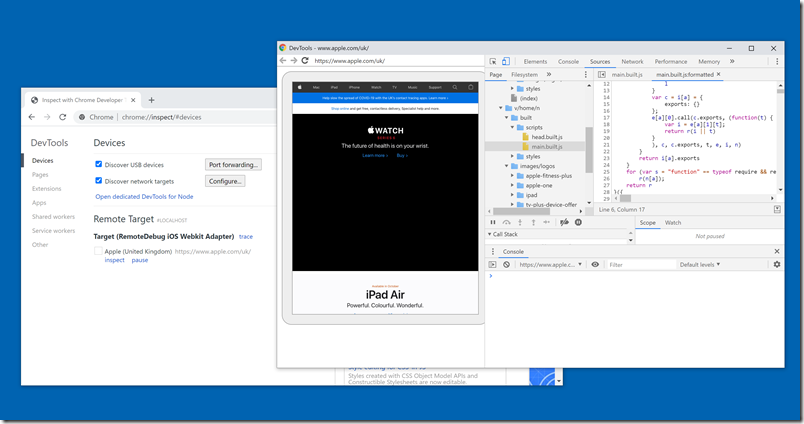
Surprisingly, what did work were the instructions here (more or less) for debugging Safari iOS on Windows. This is based on the RemoteDebug iOS WebKit Adapter described here, a project which originated as an internal Microsoft experiment.
I did find it amusing that I could do this on Windows, having failed with the Mac.
The next generation of this is Inspect. This is in private beta, though the GitHub page for RemoteDebug says it has been superseded and to use Inspect instead.
It worked for me though.
